On 7 October 2023, Hamas carried out a large scale attack against Israel, causing over 1 000 fatalities, taking more than 200 hostages and firing thousands of rockets into Israeli territory. At the time of writing, Israel’s military response has caused more than 30 000 fatalities, and more than 1.9 million Gazans are now internally displaced, corresponding to nearly 90% of Gaza’s population. The International Court of Justice issued a ruling in January of 2024 for Israel to prevent acts of genocide and take measures to enable humanitarian assistance to Gaza.
Satellite images may provide important information to document the extent and spatiotemporal patterns of the damage caused by the Israeli military operation in Gaza. Such images have been used as evidence in international criminal investigations, such as the Srebrenica trials where the Bosnian Serb Army were found guilty of genocide. They have also been used by human rights organisations to investigate and document war crimes. Amnesty International, for example, used satellite images to track the supply chain of the fuel that was used in aerial bombings of refugee camps in Myanmar.
The Israeli-Palestinian conflict dates back to a time when satellite-based earth observation was still in its infancy. The majority of the population in Gaza are refugees or descendants of refugees who were dispossessed in 1948, during the Nakba (the Palestinian catastrophe). Between 1948-67 the Gaza Strip was occupied by Egypt, and from 1967 to 2005 by Israel. Israel has since then imposed a tight blockade of the Gaza strip restricting movement of goods and people. In 2007, Hamas took over the control of Gaza from the Palestinian Authority in the West Bank. Since then, recurrent violent military confrontations have taken place between Israel and Hamas.
This Regional Outlook focuses on the role of satellite imagery in shaping our understanding of the Israeli-Palestinian conflict and the physical damage it has caused the landscape.
What war-related damage can we identify using satellite images?
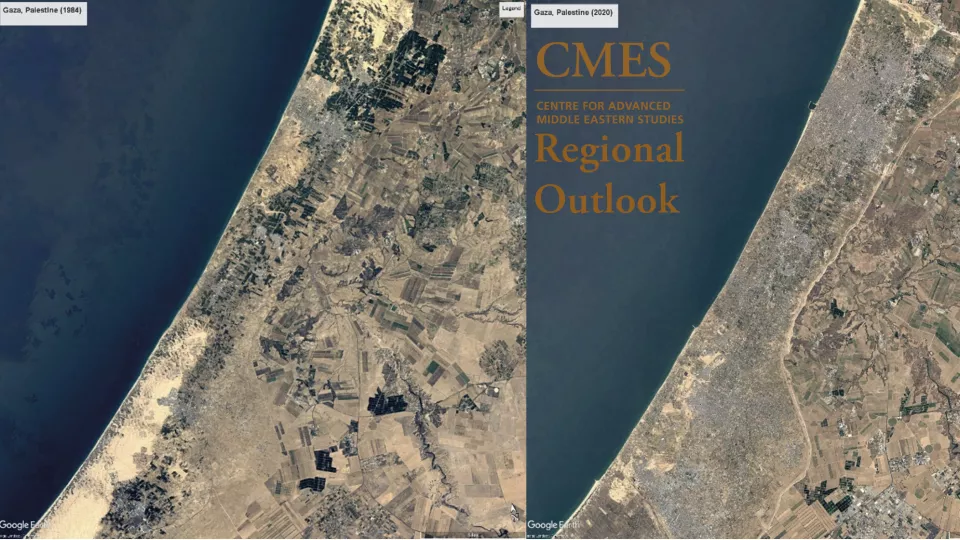
When looking at satellite images of Gaza, one of the most striking things is that we can clearly see the border between the Gaza strip and Israel, without adding any data on political boundaries. The landscape in Gaza, despite its similar biophysical characteristics, looks completely different from adjacent Israeli territory: dense and clustered urban areas and a mosaic of small agricultural patches on the Palestinian side; and an industrial agricultural landscape with large fields and distances between settlements on the Israeli side. These differences are less obvious if we go back to the 1980s, when cities in Gaza were smaller and agricultural areas more spread out. In 2020, we can see how urban areas have expanded onto arable lands, which pushes agriculture towards more marginal areas closer to the distinctly visible border wall. This is illustrated in the satellite images at the top of this page.
Agricultural damage
The Gaza strip has an area of 365 km2, which is smaller than the municipality of Lund (Sweden), and a population of over 2 million. With this population density, the demand for food is high. In 2022, the Palestinian Bureau of Statistics (PCBS) stated that about 44% of the products consumed were produced in the Gaza strip, while the rest was imported. Food imports have been severely restricted since 2007, and already before October 2023, a large share of the population was reliant on food aid. In the war that started in October 2023, Israel has severely damaged agricultural lands and infrastructure, resulting in further reductions in food availability.
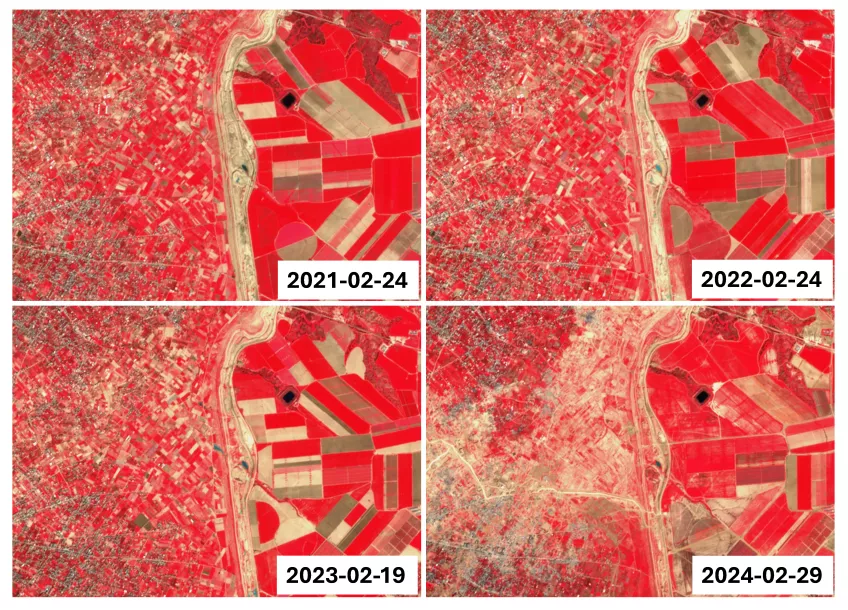
Satellite images allow us to see changes in vegetation patterns. By highlighting certain parts of the spectrum that satellite sensors register, we can easily see which areas are vegetated. The image above shows the area near As Sureij in central Gaza, during the month of February for four different years, 2021-2024. These images highlight the infrared part of the light spectrum, which indicates vegetation, so the redder the colour – the more vegetation. Between 2021 and 2023, the area shows a similar pattern, fields and their boundaries are clearly visible with some covered with crops (red colour), others are possibly fallow as the plants have not emerged yet (grey or brownish colour). For 2024, there are several noticeable changes. First, the whole area has a lot more grey/brown colouration, which means that almost all the fields are devoid of vegetation save for a few patches. Second, there is no longer a distinction between individual fields, which suggests that the area is no longer managed. The lack of field boundaries combined with the appearance of some new linear features on what was previously agricultural fields reveals that there has been destruction of the fields by heavy machinery and the creation of new roads by the Israeli military. The few patches of bright red areas within this new landscape are an indication that these are fallow lands covered in weeds, or crops that were already planted before the situation escalated.
Damage to buildings
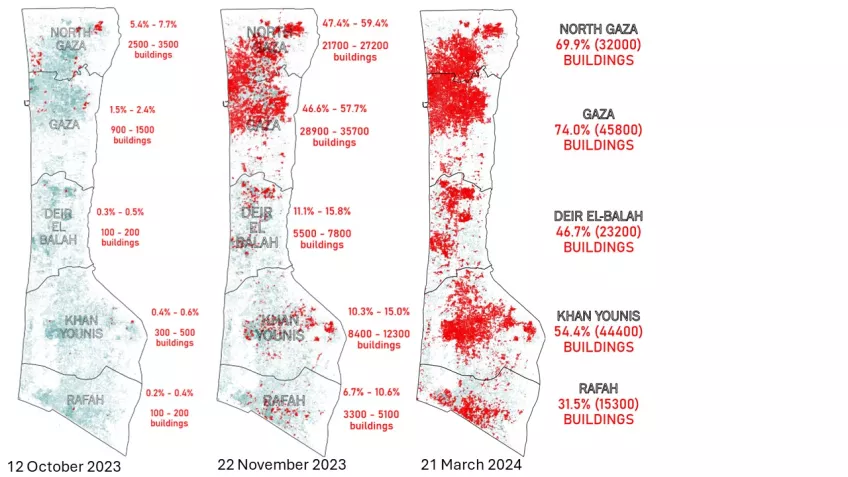
Since October 2023, researchers belonging to the Decentralized Damage Mapping Group (DDMG) have used satellite data to estimate building damage in Gaza. This analysis is based on Synthetic Aperture Radar (SAR) data from the Sentinel-1 satellite, which has also been used to map deforestation in Brazil, assess flood damage in Texas, and to identify ships in the Panama Canal. By combining SAR data with the locations of buildings in Gaza, the number of buildings partly or completely destroyed have been automatically estimated for every few days. The results show how the damage has spread from mid-October 2023 to March 2024, starting with below 2% of all buildings damaged by mid-October, to 55.9% of buildings in Gaza damaged by March 21st, 2024.
Electricity
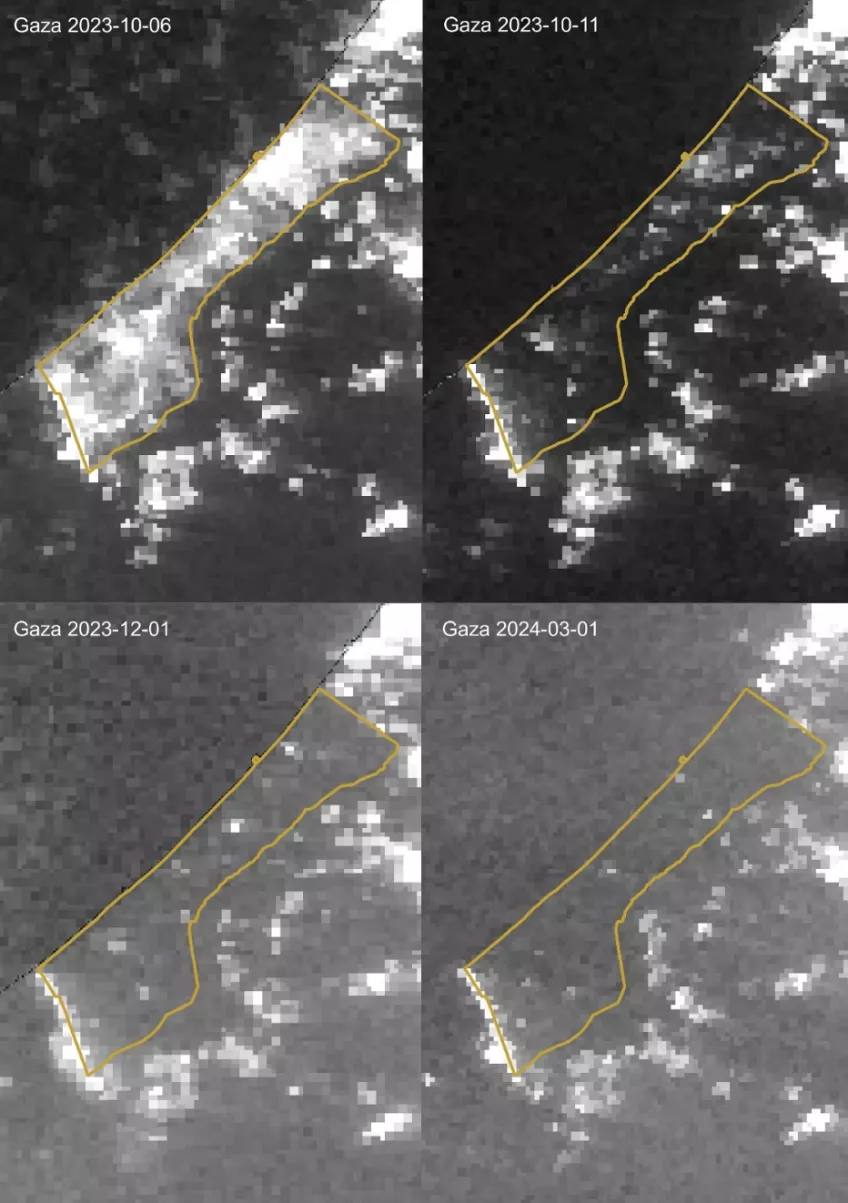
Satellite sensors can also register nighttime lights which can show differences in power supply across time and space. Nighttime lights show that Gaza rapidly turned dark after October 7th, while surrounding Israeli lights remained largely unchanged. The images below clearly show every part of the Gaza strip emitting light on October 6th, while five days later, on October 11th, only a few areas remain lit. After that, Gaza gets darker, with only a few small areas emitting light in December 2023. By March 2024, the power situation seems to have worsened, with only a handful of light points in the central and southern parts.
What could this information be used for?
Satellite images can be a reliable source of information in inaccessible areas, like war zones, and is often considered an objective source of information. The DDMG maps of damaged buildings in Gaza provided information on the destruction early in Israel’s assault and can later on be used to study the pattern of destruction over time. Satellite-based information can be used to corroborate local accounts, for example in truth commissions, international criminal investigations, post-war reconstruction efforts and even as part of early warning systems to prevent genocide.
There are, however, several limitations for what information can be extracted from satellite data. Much of the freely available data have a coarse spatial resolution, which limits the ability to see details in the data. Commercial satellite companies, which generally distribute very high resolution images, have been found to limit the availability of data in conflict zones, like Gaza, which has led to calls for publicly funded high resolution satellite programs for scientific and humanitarian uses. Another troubling issue is the emergence of deepfake geography, where satellite images are manipulated using artificial intelligence. This may cause a lowered trust in information derived from satellite images and requires the development of new methods to identify fake satellite images.
With satellite images, we may not be able to see how many people are buried under the rubble, but we can see where buildings have been destroyed. We may not be able to see the widespread starvation, but we can see how agricultural lands have become destroyed and abandoned. Satellite images may not show the people dying at hospitals due to lack of electricity, but we can see the decline in power supply across the Gaza strip. To conclude, satellite images constitute an important source of information in investigations of Israeli war crimes and human rights abuses in Gaza, as it can be used to corroborate reports from the ground.
This article is part of CMES Regional Outlook on Current Affairs series. The authors are responsible for the analysis and views expressed in this publication.